You’re accessing archived content
This is archived content from the UIT website. Information may be outdated, and links may no longer function. Please contact stratcomm@it.utah.edu if you have any questions about archived content.
Meet Your Colleagues: Service Monitoring Group
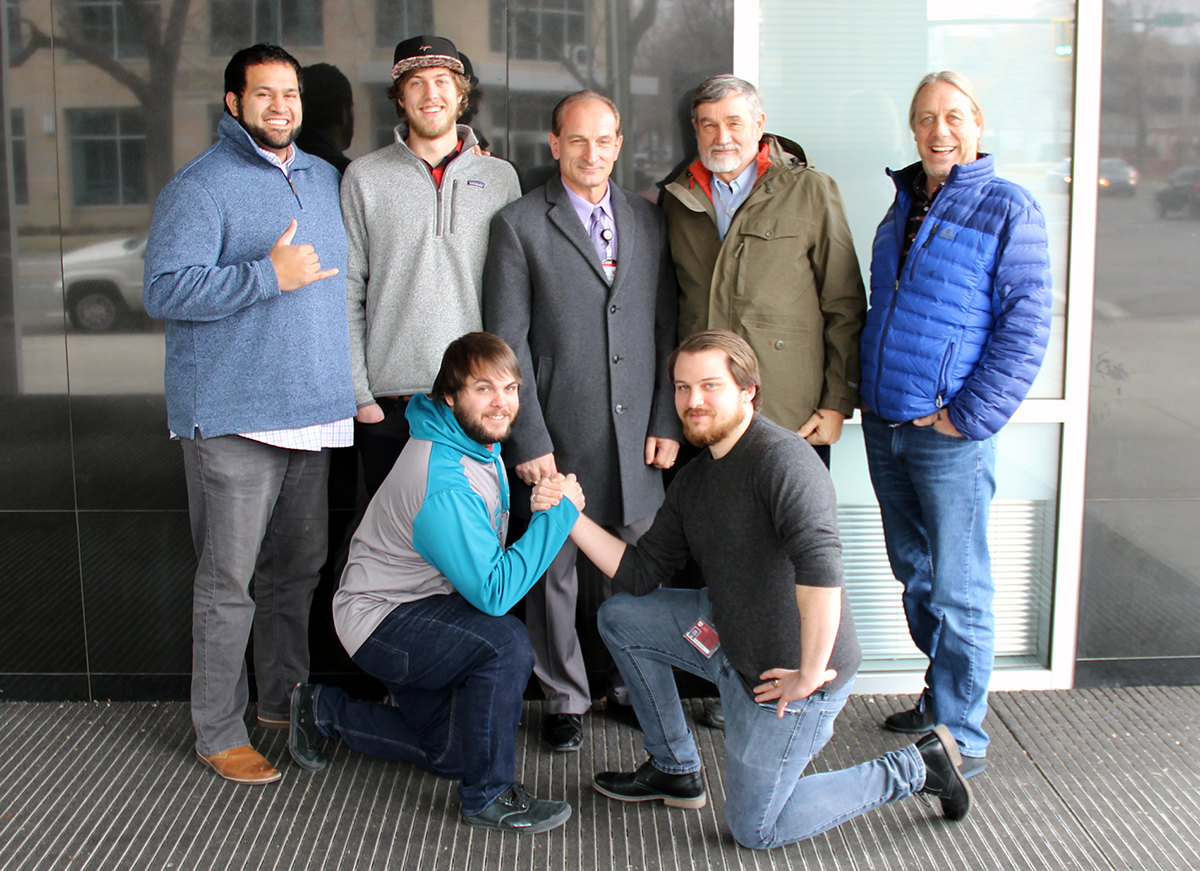
Back, L-R: Monty Kaufusi, Jacob Kerr, Dragisha Ignjatovic, Lee Shuster, and Sterling Gillman. Front, L-R: Michael Harrelson and Aleksandar IgnjatovicBy Jesse Drake
Think of IT service monitoring as a real-time health check — like a Fitbit, writ large.
Just as the popular fitness tracker keeps tabs on steps and heart rate, at any given time the Service Monitoring Group tracks the performance of approximately 20,000 devices, 123,000 unique ports, and hundreds of individual applications like Kronos (now MyTime) and Canvas.
"What we do gives the institution insights into the health of our IT services, at a high level," said Manager Monty Kaufusi.
The fitness tracker analogy is apropos for this athletic group.
Kaufusi was a Utes football player, and others have participated collegiately in water polo, hockey, boxing, and soccer. Systems Engineer Dragisha Ignjatovic played soccer professionally in San Diego during the 1980s, but is now satisfied to host local matches with his colleagues. The group also gets together to play basketball on a PEAK Health & Fitness team organized by Service Monitoring Engineer Lee Shuster, who also coaches basketball for Special Olympics of Utah.
Team spirit outside of the office reinforces their chemistry at work.
"Everyone is easy and fun to work with," said IT Specialist Aleksandar Ignjatovic, Dragisha's son. "We have a good mix of personalities, which helps cut through a lot of the repetitive day-to-day stuff."
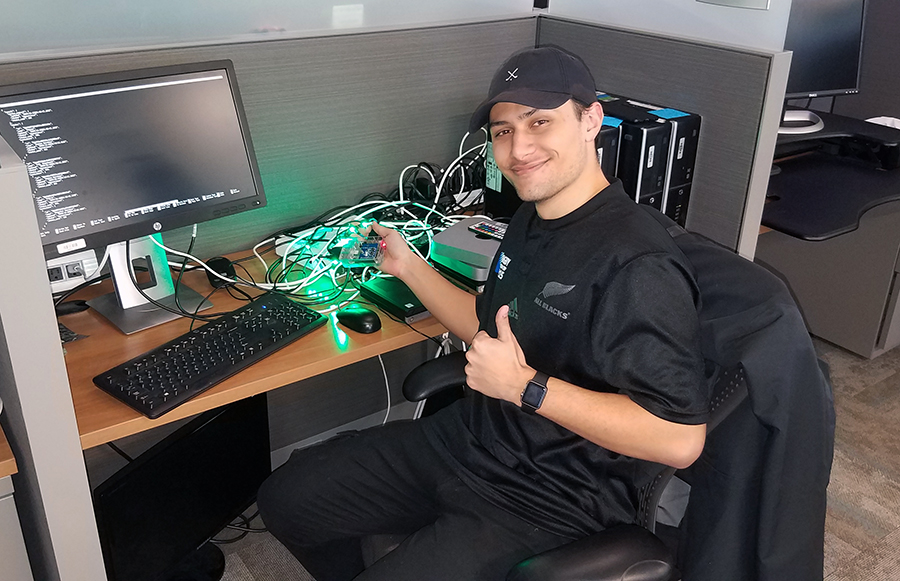
Student employee Maiko Tuitupou works on a Raspberry Pi LED monitoring project.
The team is a blend of University Information Technology (UIT) and Information Technology Services (ITS) in the Chief Technology Officer's Service Management group. Its scope includes campus and hospitals/clinics.
"Any place that the university has any kind of network presence, Wi-Fi or ethernet, we have monitoring in place," Shuster said.
Monitoring activities can help identify issues before a service disruption and empower ITS and UIT help desks with web-based analytics and dashboards.
"Orion [UIT's system monitoring tool] helps us to do a lot of different network monitoring tasks, like alerting, dashboards, configuration management, device tracking, and reporting," said Systems Administrator Jacob Kerr, adding, "we work with a lot of different teams." For example, they report synthetic web transactions to University Support Services (USS) and provide the Network Operations Center (NOC) with data.
To dispel any Big Brother-ish baggage attached to a word like "monitoring," Shuster explained that end user devices are not involved in synthetic transaction monitoring. Rather, small devices like a Mac or HP Mini are deployed in communications closets around the university and run behavioral scripts that simulate the path an end user takes through a website.
"We let these synthetic transactions run on that as if it was an end user. That way we don't have to put anything on anyone's device," Shuster said.
End users can keep themselves informed about planned system maintenance events and outages, thanks to an IT Services Status page that was deployed by UIT in 2016. The webpage shows the status of mission-critical IT services in real time, in addition to maintenance schedules and history. Integrated connections to Orion enable service status updates as soon as monitoring tools detect a change. If a service is listed as degraded or unavailable, it means that technical teams are aware of a problem and working on a fix. And because the page is hosted independently of the university IT ecosystem, in the rare and unfortunate event of a wide-scale outage, it will remain available for the U community.
"Together, all these things act as an early warning system to alert people if there are any issues," said Systems Administrator Michael Harrelson. "We'll look at things like disk usage to see if servers are getting full ... we keep error logs for people, and we conduct a lot of ping checks to make sure hosts are up and running."
Monitoring and logging overlap and are often conflated, but logging deals specifically with log files. Servers, firewalls, and other IT equipment keep files that record events and transactions. Every time an application does anything, it records it in a log where that can be analyzed to refine operations, improve network security, or inform new code changes, among other things.
One tool that the team uses to analyze log files is ELK Stack, a collection of open-source projects Elasticsearch, Logstash, and Kibana. ELK Stack (also called Elastic Stack) searches, analyzes, and visualizes log data from any source.
"Elastic can handle a ton of data, and is generally used for logs, but you can also use it to look at our system information, too," said Systems Engineer Sterling Gillman. Considering that the team logs more than 2TB of data a day, indexing about 25,000 campus events per second, having tools this robust is essential.
Node 4
Our monthly newsletter includes news from UIT and other campus/ University of Utah Health IT organizations, features about UIT employees, IT governance news, and various announcements and updates.