You’re accessing archived content
This is archived content from the UIT website. Information may be outdated, and links may no longer function. Please contact stratcomm@it.utah.edu if you have any questions about archived content.
Network News: SolarWinds helps UIT stay on top of system performance
Note: This column is part of a new semi-regular feature that highlights current events in UIT's network operations group.

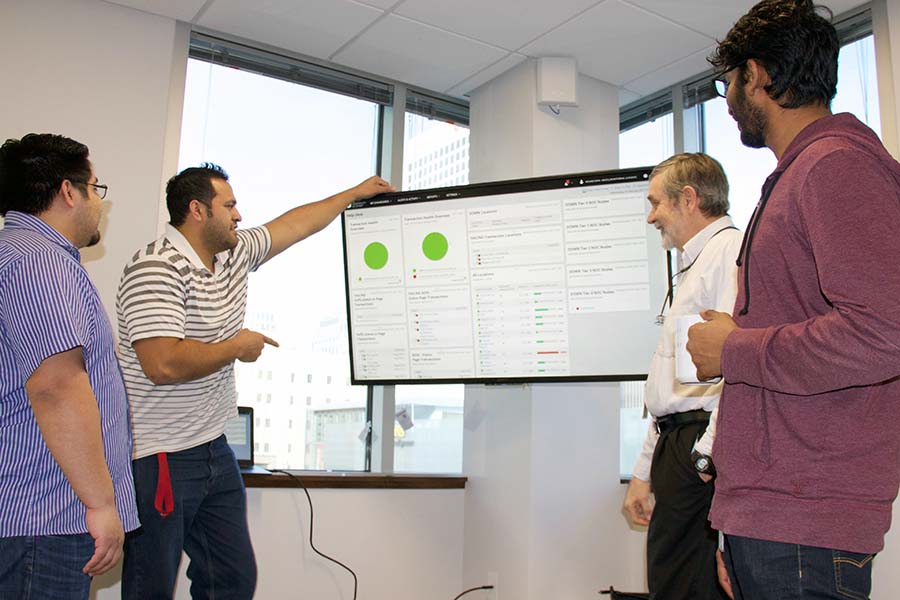
UIT Monitoring Team members, from left: Victor Morales, Monty Kaufusi, Lee Shuster, and Rahul Ramkumar.
When campus outages occur, users expect transparency and accountability from UIT as the organization works to resolve the issues.
To help meet that expectation, UIT's Monitoring and Logging team evaluates the performance of the University's technical systems to ensure fast, accurate reporting of any degraded services. This effort includes communication between all areas within UIT and empowering help desks with salient web-based analytics and dashboards.
The U's Network Operations Center (NOC) receives real-time metrics on the status of University applications from campus, clinical and external locations, which can be viewed on a SolarWinds-powered Health Summary Dashboard.
"We are monitoring a lot of information to keep outages to a minimum, and one of the things we're watching for is network equipment entering a warning state, or if the network equipment goes down," said NOC Network Engineer Brian Sorensen.

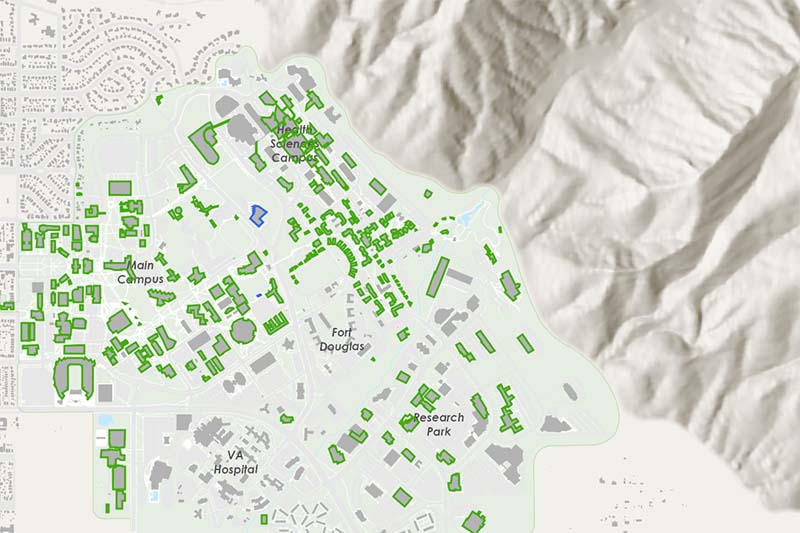
The U's network equipment map powered by SolarWinds.
Sorensen had the idea to convert this information into a campus map of network equipment. Before the map came into fruition, data from SolarWinds was reported in list form. Sorenson and IT Specialist Tyler Sauer collaborated with Rachel Albritton, Geographic Information Systems (GIS) analyst in Facilities Management, and UIT’s Monitoring and Logging team led by Manager Elliot Fenech, with key roles played by IT Specialist Kevin Cai and Database Administrator Josh Grey.
The map features an overlay of network equipment information on a campus map, allowing for an easy location assessment of connectivity issues.
"It's eye-catching, which is helpful when you're working in a situation where you are flooded with information,” Sorensen said.
The new interface helps the Network team key in on problems that arise at a single location.
"With the map, we can see what devices are impacted in the building, what state they are in, building information, and if construction is ongoing in the area," Sorensen said.
The map was built entirely by Albritton.

Brian Sorensen,
NOC network engineer
"One of our goals as GIS Analysts is to help our clients visualize their data in new and meaningful ways that can help them make informed management decisions," Albritton said. "As the project continues to expand, I look forward to working with Brian, Elliot, and their associated teams to develop new or improved solutions.”
Sorensen lauded the collaborative effort.
"It was a pleasure to work with everyone, and Rachel was very helpful," he said.
Indirectly, SolarWinds data also informs the U’s IT Services Status page, to which users can subscribe and receive updates. The website and associated Twitter feed allow users to see the status of mission-critical IT services any time, in addition to maintenance schedules and the history of maintenance events.
If users notice a problem with a UIT or ITS service, they're encouraged to check the status page first before calling the UIT Help Desk or ITS Service Desk. If the page indicates that the service is degraded or unavailable, it means technical teams are already aware that there's a problem and are working on a fix.
Monitoring by the numbers
At any given time, UIT:
- Monitors about 1,500 devices
- Gathers information from 123,000+ unique ports
- Analyzes the performance of 340 individual web applications (Canvas, Epic, Kronos, now MyTime, etc.)
- Tracks user internet experience from 39 locations, including clinics statewide (will reach 60 by May)
Node 4
Our monthly newsletter includes news from UIT and other campus/ University of Utah Health IT organizations, features about UIT employees, IT governance news, and various announcements and updates.
