PMO Corner: Viavi Observer will help UIT analyze, troubleshoot network traffic
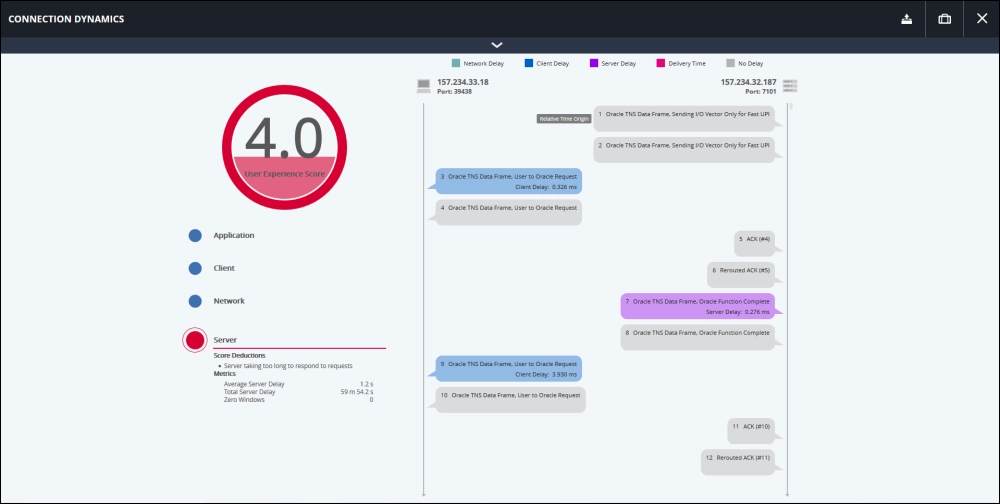
In this screenshot, Viavi Observer integrated with Amazon virtual private cloud traffic monitoring displays an aggregate end user experience score out of 10. Image courtesy of Viavi Solutions.
The University of Utah’s network ecosystem is massive. A mostly unseen highway of data pathways — routers, switches, firewalls, servers, wireless access points, and other network devices — combines to support 281,000 wired ports and more than 60,000 connected devices every day. Its systems and components are simply too complex for humans to manage alone.
Network monitoring tools fill the gap by collecting and analyzing data from network-connected software and devices. The information gleaned by these tools help network engineers quickly identify and address service-impacting issues as they’re detected.
UIT has purchased and is testing Viavi Solutions’ Observer platform, a suite of networking performance monitoring and diagnostics (NPMD) software products that visualizes and analyzes network and server traffic.
“It gathers and analyzes network data in the form of packet captures from the core network and network flows, which will help us determine how well the network is functioning,” said Alan Vesper, a network engineer in UIT Network Services.
A packet is a multibyte unit of data transmitted by a host, such as a server. Data sent over networks is broken up into packets and reconstructed by the destination device, which facilitates faster, more efficient data transfer. Flow refers to a sequence of packets in a network.
A 2024 study by Viavi Solutions and TechTarget’s Enterprise Strategy Group found that 88% of organizations believe threat management capabilities are important or critical, and that entities with a network observability strategy are 3.5 times more likely to rapidly detect disruptive incidents.
Vesper said Observer helps troubleshoot network issues and determine root cause by replacing dozens of key performance indicators (KPIs) with a single metric that includes a detailed score with a wealth of information on traffic patterns, latency, and bandwidth, among other things.
“The pathing information it provides tells you where network traffic is going, where it is stopped, and if there are slowdowns,” he said.
Brent Wimber, an IT project manager for UIT’s Project Management Office, said Observer measures the quality of user experience by observing different layers of performance in a technology stack. In the networking world, stack is a metaphor to describe how a collection of software systems is used and interacts.
“The tools that make up the Observer suite are designed to integrate with each other or work independently to ensure secure and successful network operations,” Wimber said, noting that Observer works with several Cisco products deployed in the U’s network environment.
Vesper said his team is in the process of demonstrating Observer for network and IT security operations groups at the U of U and University of Utah Health, and he expects it will be deployed into the U network environment before the start of fall semester.
“Maintaining IT service health begins with complete visibility into network traffic,” Wimber said. “Observer has the potential to streamline network operations and improve incident response time.”
Node 4
Our monthly newsletter includes news from UIT and other campus/ University of Utah Health IT organizations, features about UIT employees, IT governance news, and various announcements and updates.