You’re accessing archived content
This is archived content from the UIT website. Information may be outdated, and links may no longer function. Please contact stratcomm@it.utah.edu if you have any questions about archived content.
CHPC aids in creation of largest 3D map of the universe
Note: This article was first published in @theU on July 20, 2020.
The Sloan Digital Sky Survey (SDSS) released today a comprehensive analysis of the largest 3-D map of the universe ever created. At the heart of the new results are detailed measurements of more than 2 million galaxies and quasars covering 11 billion years of cosmic time.
“We know both the ancient history of the universe and its recent expansion history fairly well, but there’s been a troublesome gap in the middle 11 billion years,” said cosmologist Kyle Dawson of the University of Utah, who led the team announcing today’s results. “For five years, we have worked to fill in that gap, and we are using that information to provide some of the most substantial advances in cosmology in the last decade.”
The results come from the extended Baryon Oscillation Spectroscopic Survey (eBOSS), an international collaboration of more than 100 astrophysicists that is one of the SDSS’s component surveys.
We know what the universe looked like in its infancy thanks to thousands of scientists from around the world who have measured the relative amounts of elements created soon after the Big Bang, and who have studied the Cosmic Microwave Background. We also know its expansion history over the last few billion years from galaxy maps and distance measurements, including those from previous phases of the SDSS.
“The analyses have also provided measurements on how the diverse structures in the universe grow over time,” says Zheng Zheng, professor of physics and astronomy at the U. “The story underneath the structure growth is amazingly consistent with what we learn from the expansion history.”
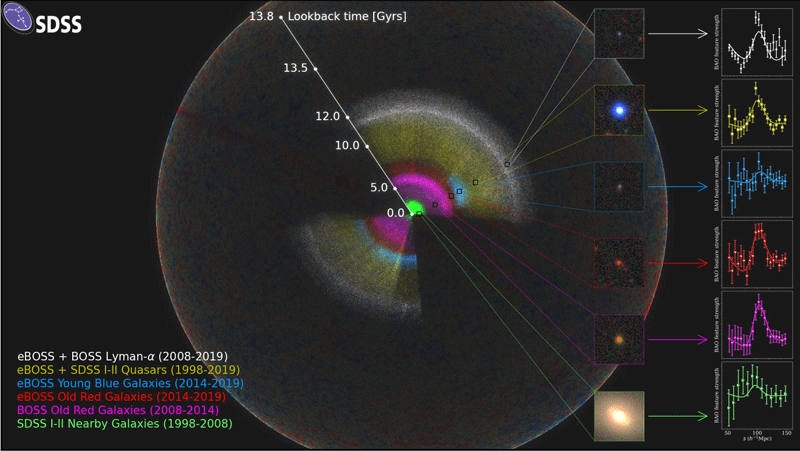
(Courtesy of Anand Raichoor, EPFL; Ashley Ross, Ohio State University; and SDSS) The SDSS map is shown as a rainbow of colors, located within the observable universe (the outer sphere, showing fluctuations in the Cosmic Microwave Background). We are located at the center of this map. The inset for each color-coded section of the map includes an image of a typical galaxy or quasar from that section, and also the signal of the pattern that the eBOSS team measures there. The bump visible in each panel is at the characteristic scale of about 500 million lightyears. As we look out in distance, we look back in time. So, the location of these signals reveals the expansion rate of the universe at different times in cosmic history.
The final map is shown in the accompanying image. A close look reveals the filaments and voids that define the structure in the universe, starting from the time when it was only about 300,000 years old. From this map, researchers measured patterns in the distribution of galaxies, which gave several key parameters of the universe to better than 1% accuracy. The signals of these patterns are shown in the insets in the accompanying image.
The map represents the combined effort of hundreds of scientists mapping the universe using the Sloan Foundation telescope for nearly 20 years. The cosmic history showed that about 6 billion years ago, the expansion of the universe began to accelerate, and has continued to get faster and faster ever since. This accelerated expansion seems to be due to a mysterious invisible component of the universe called “dark energy,” consistent with Einstein’s General Theory of Relativity, but extremely difficult to reconcile with our current understanding of particle physics.
Combining observations from eBOSS with studies of the universe in its infancy revealed cracks in this picture of the universe. In particular, the eBOSS team’s measurement of the current rate of expansion of the universe (the “Hubble Constant”) was about 10% lower than the value found from distances to nearby galaxies. The high precision of the eBOSS data means that it is highly unlikely that this mismatch was due to chance, and the rich variety of eBOSS data gave us multiple independent ways to draw the same conclusion.
“Imprinted in the galaxy or quasar distribution is a particular pattern that serves as a ruler,” said Zheng. “With eBOSS maps, such a ruler has achieved its best-ever performance and enabled us to measure distances with unprecedented precision, which makes it possible to most clearly reveal the mismatch in the Hubble Constant.”
There is no broadly accepted explanation for this discrepancy in measured expansion rates, but one exciting possibility is that a previously-unknown form of matter or energy from the early universe might have left a trace on our history.
In total, the eBOSS team made the results from more than 20 scientific papers public today. Those papers describe, in more than 500 pages, the team’s analyses of the latest eBOSS data, marking the completion of the key goals of the survey.
The University of Utah has been a key contributor to SDSS over the last decade. The massive samples of spectroscopic data that went into the final eBOSS cosmological result were processed and located at the U, within the Science Archive Server hosted by the U’s Center for High-Performance Computing.
“We have made a series of developments in the data analysis, leading to greater precision in the cosmological map. This team effort was made possible by our cutting edge science archive system. The final eBOSS data products will remain a legacy, helpful to a broad range of users, from young students to amateur and professional astronomers,” says SDSS-IV science archive scientist Joel Brownstein, research associate professor at the U.
Within the eBOSS team, individual groups at universities around the world focused on different aspects of the analysis. To create the part of the map dating back 6 billion years, the team used large, red galaxies. Farther out, they used younger, blue galaxies. Finally, to map the universe 11 billion years in the past and more, they used quasars, which are bright galaxies lit up by material falling onto a central supermassive black hole. Each of these samples required careful analysis in order to remove noise and reveal the patterns of the universe.
“The SDSS data allow unique insights into the evolutionary history of our universe,” says Dawson. “Using these data, along with data from the Cosmic Microwave Background and supernovae, we have made the largest advances of any experiment in the last decade to determine the intrinsic curvature of space. We have explored the energy contents of the universe, the laws of gravity, and the physics of some of the smallest particles, the neutrinos, and now have a model for these components that allows us to estimate the local expansion rate to 1% precision.”
eBOSS, and SDSS more generally, leaves the puzzle of dark energy, and the mismatch of local and early universe expansion rate, as a legacy to future projects. In the next decade, future surveys may resolve the conundrum, or perhaps, will reveal more surprises.
Meanwhile, the SDSS is nowhere near done with its mission to understand the Universe. Gail Zasowski, the spokesperson for the next generation of SDSS, described her excitement for the next steps.
“We’re upgrading the hardware and instruments needed to keep the tremendous impact of SDSS going into the 2020s. We’ll be focusing on the history of our own Milky Way Galaxy, the architecture of multi-star and planetary systems, how galaxies make their stars, and how black holes grow over the lifetime of the Universe. These are some of the most exciting questions in astrophysics, and we’re looking forward to the next decades of discovery!”
Node 4
Our monthly newsletter includes news from UIT and other campus/ University of Utah Health IT organizations, features about UIT employees, IT governance news, and various announcements and updates.